SQL Agent Jobs Timeline with dbatools.io (download)
This is now part of dbatools.io and has more features! Go get the latest version and watch this space as there are more graphs to come!
Concept
Continuing from my previous post: SQL Server Performance Dashboard Using PowerBI, another important element of performance monitoring is knowing what SQL agent jobs run at what time to understand and avoid potential clashing. Notice the underlined what time – time correlation is very important when it comes to performance but finding it is not always easy.
I wrote a simple PowerShell script to help visualise what jobs run and when. However, before we get to it, let’s have a quick look at what options DBAs currently have to analyse agent jobs. Or you can skip right to the Timeline Report and download it below.
SQL Server Management Studio Reports
In SQL Server Management Studio we can view agent jobs in the Job Activity Monitor which is really only focusing on the current state of play. SSMS comes however with a couple of SQL Agent Reports which can give some insight into the historical workload:
- Top Jobs
- Job steps execution history
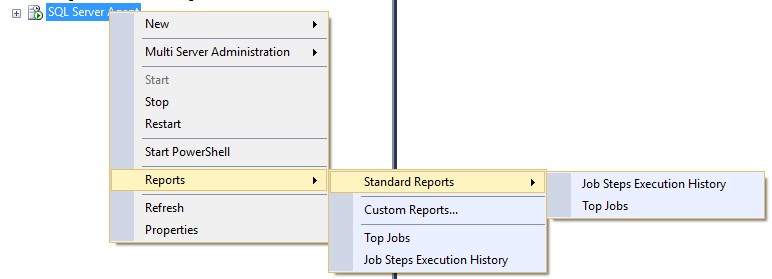
To see Standard Reports, right-click on the SQL Server Agent, go to Reports -> Standard Reports:
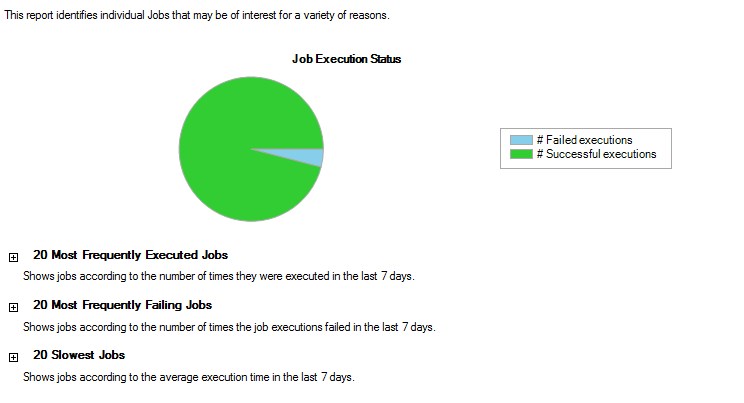
Top Jobs
Top Jobs report shows us a list of most frequently executed, most failing and slowest jobs
The slowest jobs report, as we can guess, will show those that take the longest to run and, unsurprisingly, in most cases this will be Backups and DBCC CHECKDB tasks. I wish there was a report to show which jobs have slowed down over time.
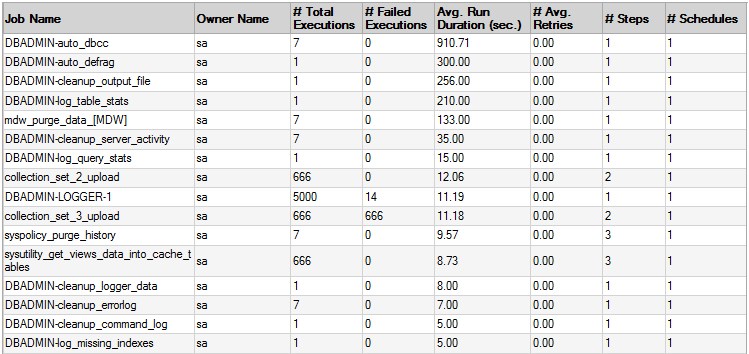
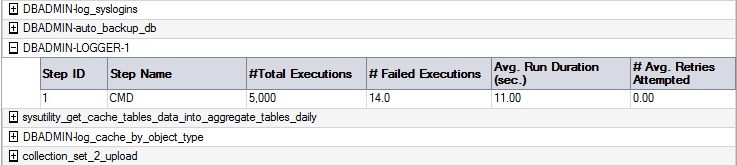
Job Steps Execution History
The Job Steps Execution History report shows a list of jobs which can be expanded to show individual steps with some basic figures such as a number of executions, failure count, average runtime and average retries. However, this will be quite challenging to explore on servers with a large number of jobs
SQL Operations Studio
SQL Operations Studio is a new product from Microsoft which can be expanded with plugins. There is a SQL Server Agent plugin provided by Microsoft which gives us a nice insight into the SQL Agent:
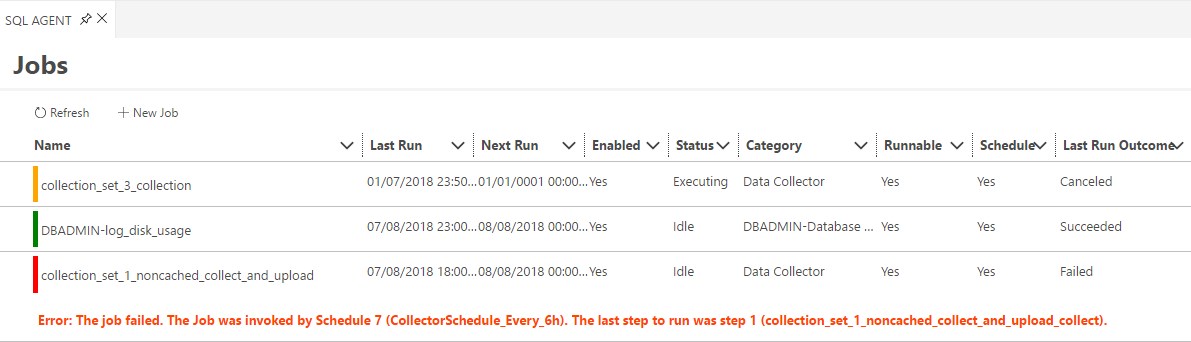
Whilst this is a nice improvement over the SSMS offerings, it still not really what I am looking for.
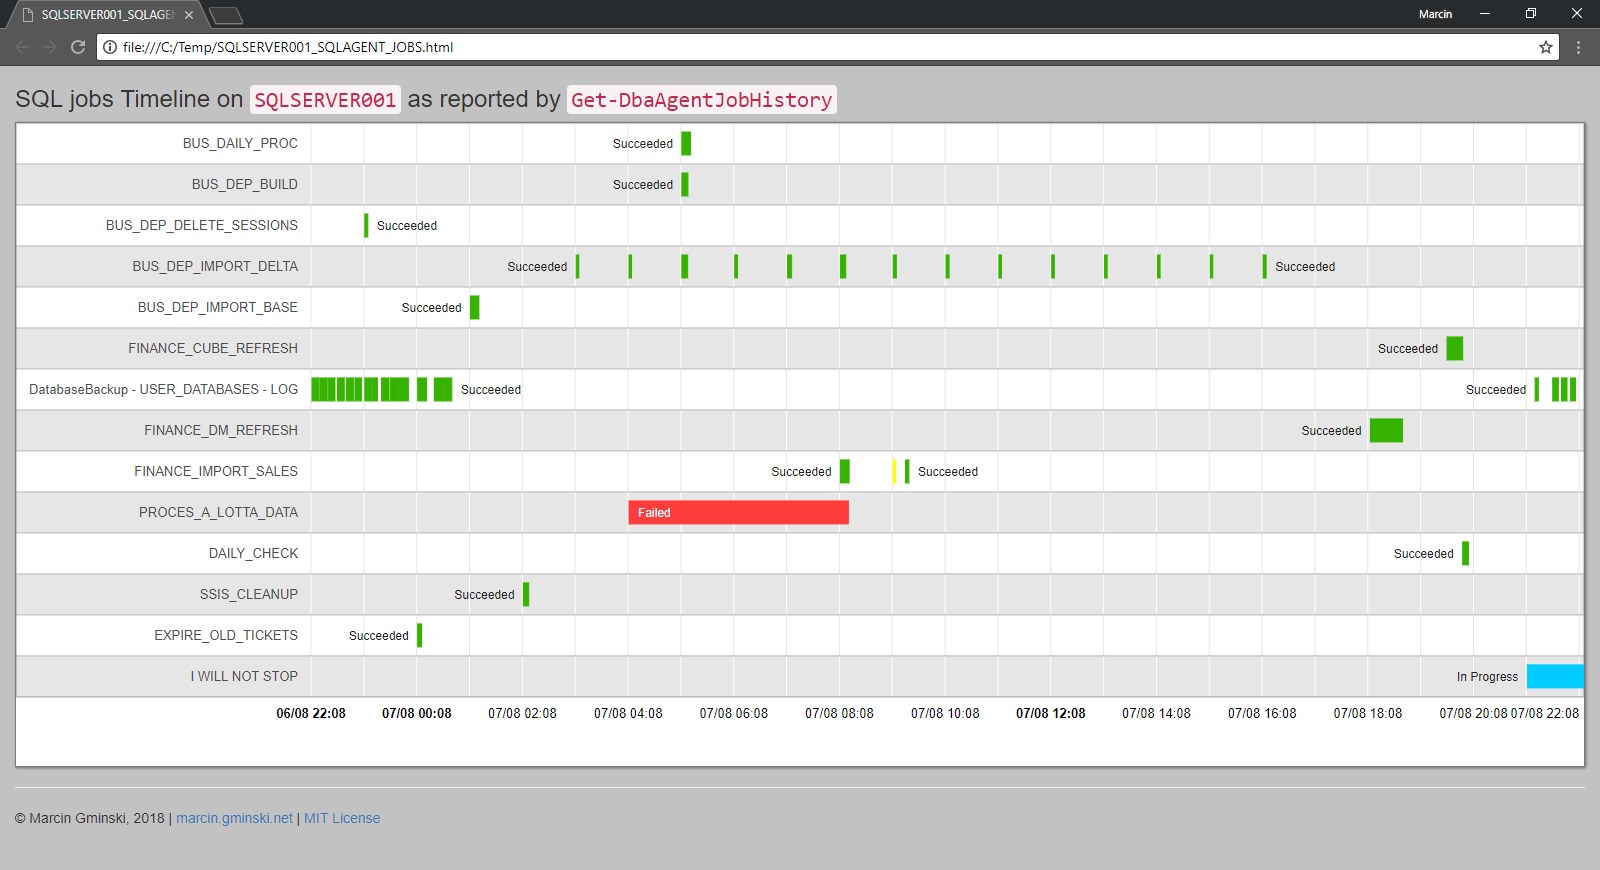
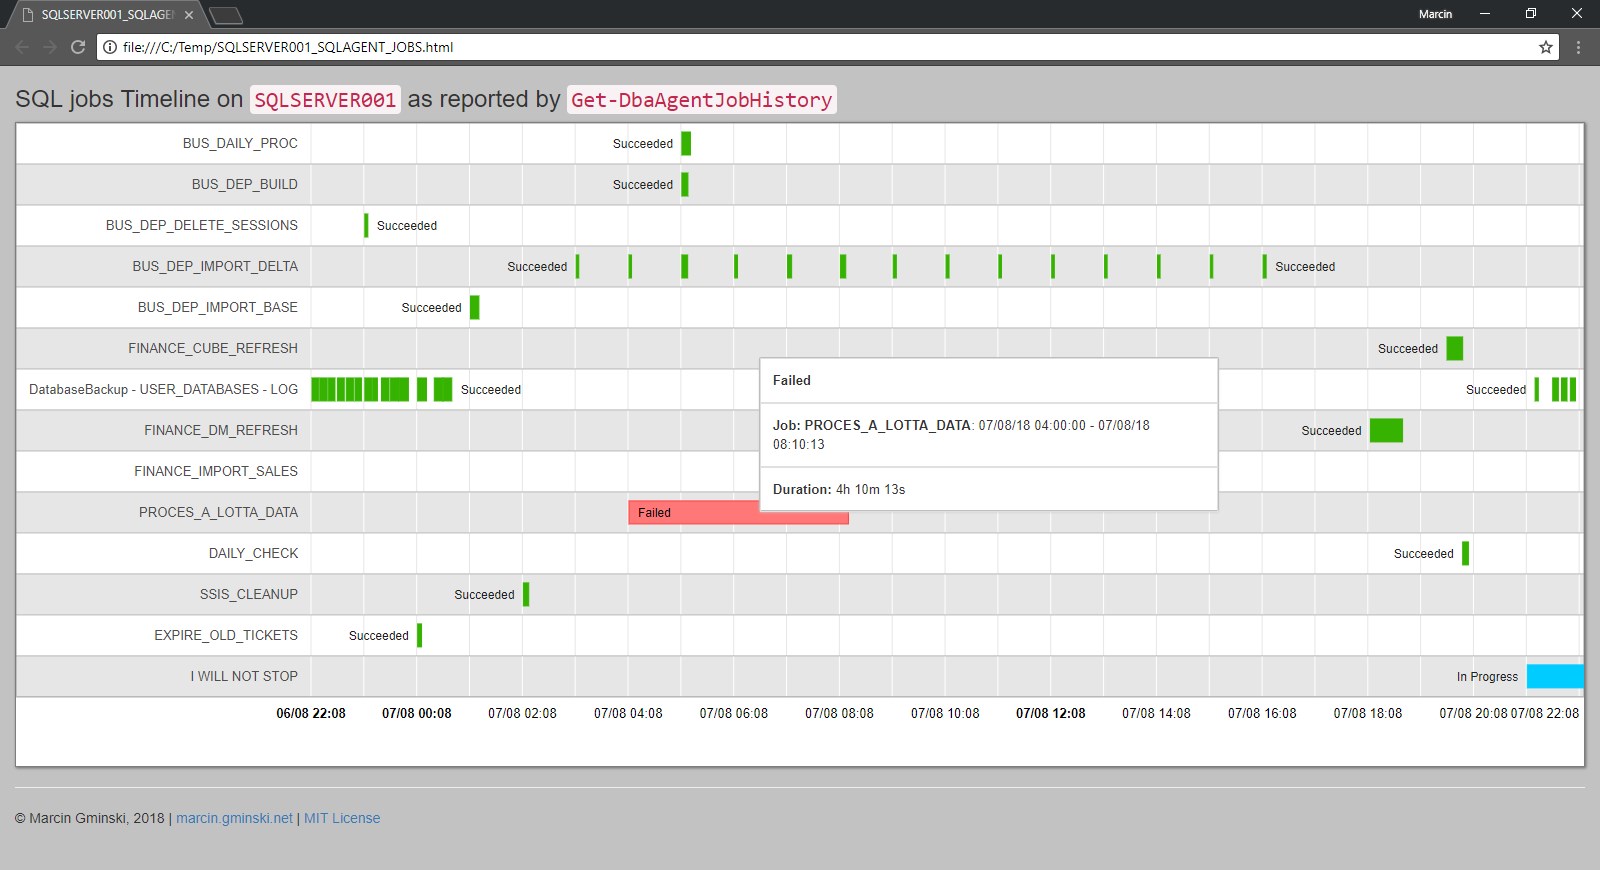
The Timeline Report
The built-in SQL Server Reports and SQL Operations Studio provides me with some good but high-level information but I really miss the time element. To address this, I wrote a simple PowerShell script which takes input from DbaAgentJobHistory and presents it on a timeline:
The Mechanics
The PowerShell script is super simple and self-explanatory. In essence, it does the following:
- Receive job execution history passed as input from dbatools.io’s DbaAgentJobHistory
- Generate Bootstrap based HTML file with Google Timeline Chart.
- Save the file to disk
- Open file in the default browser (switch)
Google Charts are JavaScript-based which means the entire data set must be embedded within the HTML file itself. It would be also possible to feed it from a server-side JSON response/stream so theoretically, we could have a simple web service querying our SQL Server and presenting results as JSON response for Google Chart consumption but that’s for a whole different post.
The biggest job here is to create a JavaScript array and all Google Chart options. This is a snapshot of what our dataset looks like in JavaScript array:
dataTable.addRows([
 ['BUS_DEP_IMPORT_DELTA','Succeeded','#36B300',new Date(2018, 7, 07, 16, 00, 00), new Date(2018, 7, 07, 16, 04, 34)],
 ['BUS_DEP_IMPORT_BASE','Succeeded','#36B300',new Date(2018, 7, 07, 01, 00, 00), new Date(2018, 7, 07, 01, 10, 39)],
 ['FINANCE_CUBE_REFRESH','Succeeded','#36B300',new Date(2018, 7, 07, 19, 30, 00), new Date(2018, 7, 07, 19, 47, 45)],
 ['DatabaseBackup - USER_DATABASES - LOG','Succeeded','#36B300',new Date(2018, 7, 06, 22, 00, 00), new Date(2018, 7, 06, 22, 08, 43)],
 ['DatabaseBackup - USER_DATABASES - LOG','Succeeded','#36B300',new Date(2018, 7, 06, 22, 10, 00), new Date(2018, 7, 06, 22, 18, 25)],
Installation
You will need dbatools.io, if you don’t already use it you have to check it out – it is the best PowerShell framework for SQL DBAs. Once you have dbatools.io installed, simply grab the ps1 file from my GitHub and have fun.
Execution
The script accepts the following parameters:
- -DbaAgentJobHistory – output from the dbatools.io DbaAgentJobHistory
- -NoOpen – tells the script to not open the output file in the browser.
It does not accept pipe input. Piping is a bit like streaming data, it’s great a have small memory footprint but in order to generate a report, we need a static snapshot to build JavaScript arrays and few other bits.
The easiest way to run it:
.Get-DbaAgentJobHistoryTimeline.ps1 -DbaAgentJobHistory $(Get-DbaAgentJobHistory -SqlInstance SQLSERVER001 -StartDate '2018-08-07 20:00' -EndDate '2018-08-08 20:00' -NoJobSteps | ?{$(Get-Date $_.EndDate)-gt $(Get-Date $_.StartDate.AddMinutes(1))} )The last bit:
?{$(Get-Date $_.EndDate)-gt $(Get-Date $_.StartDate.AddMinutes(1))excludes any jobs that took less than 1 minute to run as we are probably not interested in them anyway.
To make it a bit more transparent we can shuffle it around a bit:
#store output from dbatools.io Get-DbaAgentJobHistory in a variable:
$history = Get-DbaAgentJobHistory -SqlInstance SQLSERVER001 -StartDate '2018-08-07 20:00' -EndDate '2018-08-08 20:00' -NoJobSteps

#now filter the original dataset and remove any jobs that took less than n mintues to run:
$history = $history | ?{$(Get-Date $_.EndDate)-gt $(Get-Date $_.StartDate.AddMinutes(1))}

#pass the $history variable into my script:
.Get-DbaAgentJobHistoryTimeline.ps1 -DbaAgentJobHistory $history
The resulting HTML will appear in the same folder as the Get-DbaAgentJobHistoryTimeline.ps1 script.
Thanks for reading, enjoy!
This post was originally published on April 8, 2020.