Dynamic data sources in PowerBI Desktop
Abstract
PowerBI Desktop is a data analytics and presentation tool. Defining data sets is very easy and usually involves creating connection string to the source data and defining objects to pull data from. Alternatively, for SQL databases we can write custom SQL script to query source data. However, if we want to pull data from 5 different data sources, we have to create 5 different data sets and connection strings. What if we had 50 SQL Servers and wanted to plot the history of SQL Agent jobs or any other common metric? And what if we wanted to create a template and be able to feed a different list of servers every time? This could be challenging but hopefully, PowerBI can be dynamic.
PowerBI Functions to the rescue
This is not immediately obvious when working with the PowerBI Desktop interface, but it does offer dynamic functions, but we have to write it by hand.
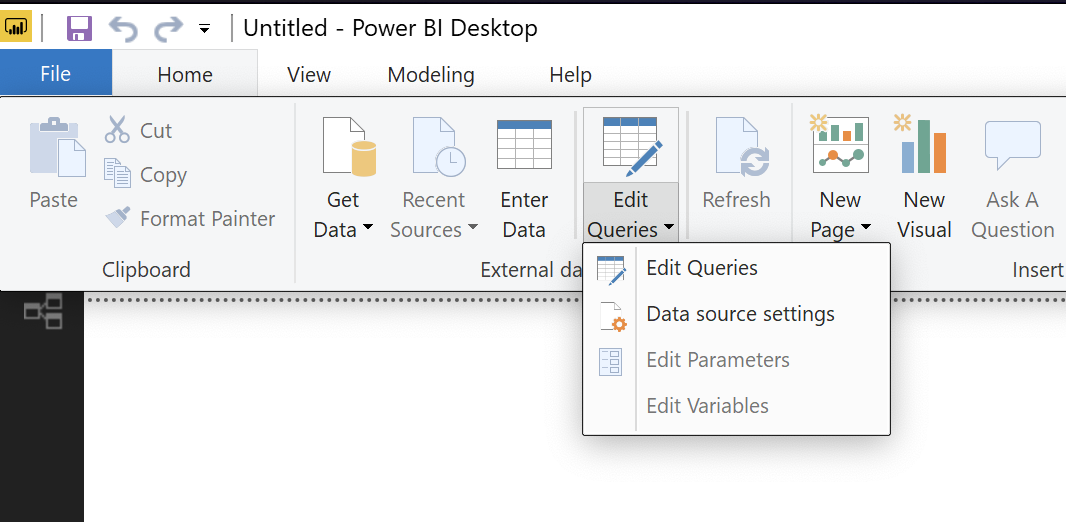
Open blank PowerBI Desktop dashboard and go to Edit Queries:
Once in the query editor create a blank query:
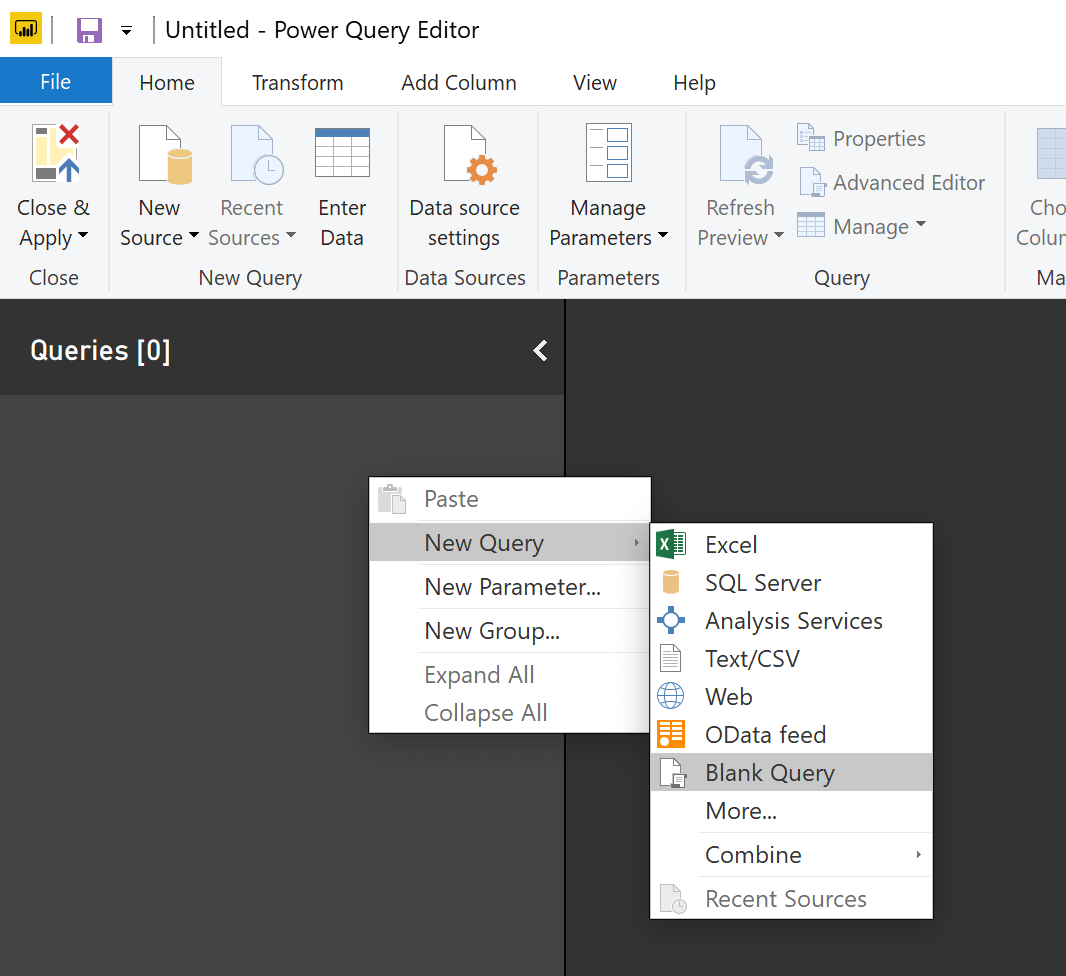
And open Advanced Editor where we can write our function to retrieve data:
let
    Source = (sql_instance as any) =>
    let
        Result = Sql.Database(sql_instance, "master", [Query="SELECT name FROM sys.databases"])
    in
        Result
in Source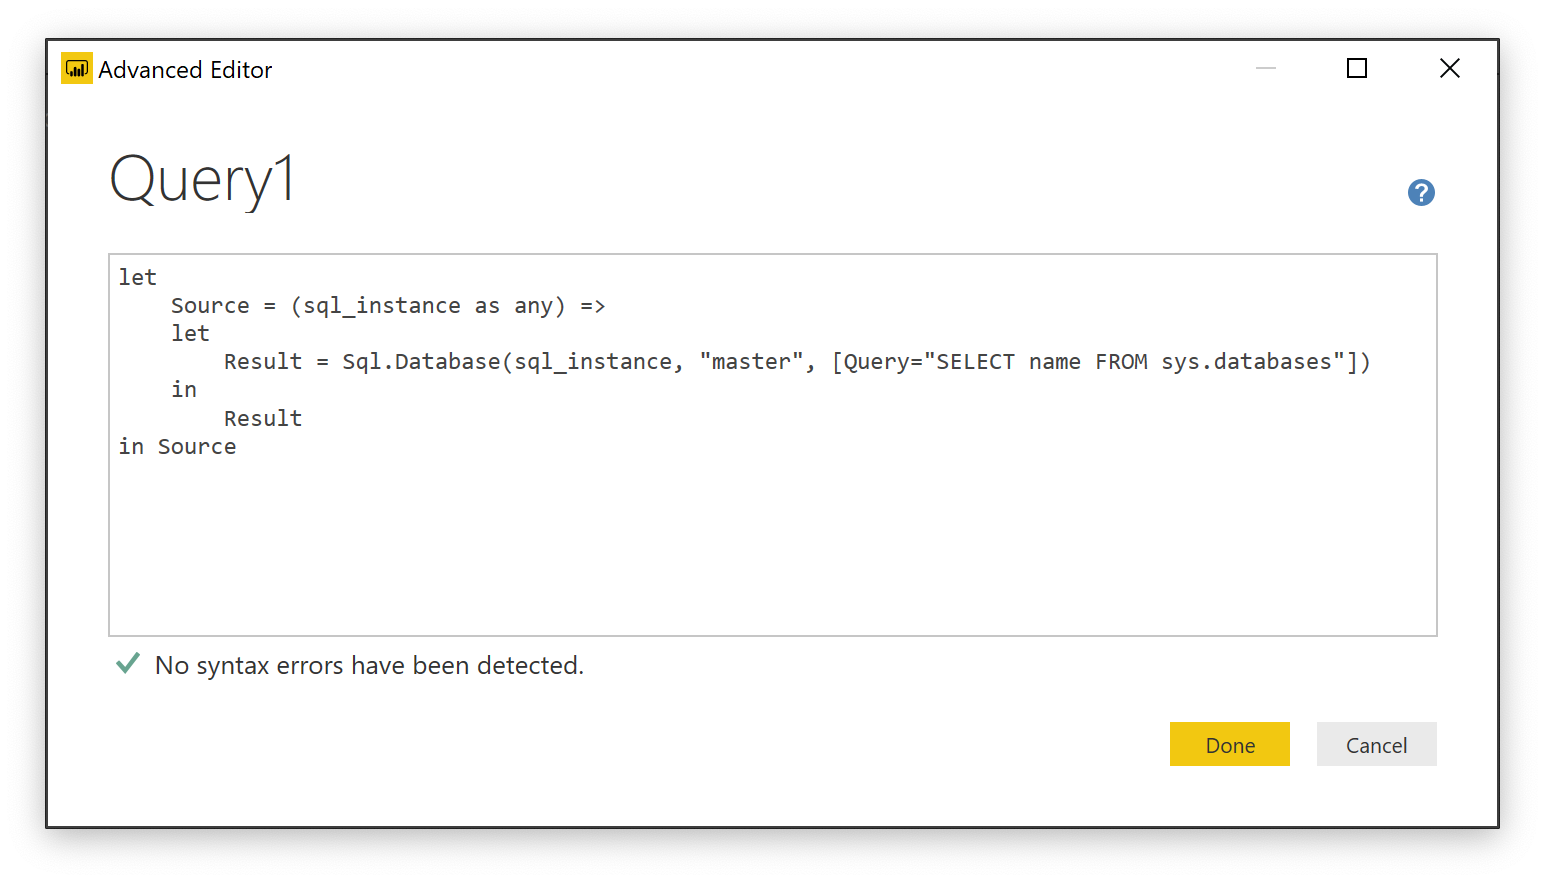
This will connect to an instance defined in the sql_instance variable, database master (this could also be a parameter) and execute SQL query Query
In our example, we are just getting a list of databases and once you save the query, you will notice an input parameter:

We can invoke the function by simply passing sql_instance which will create a new result set:
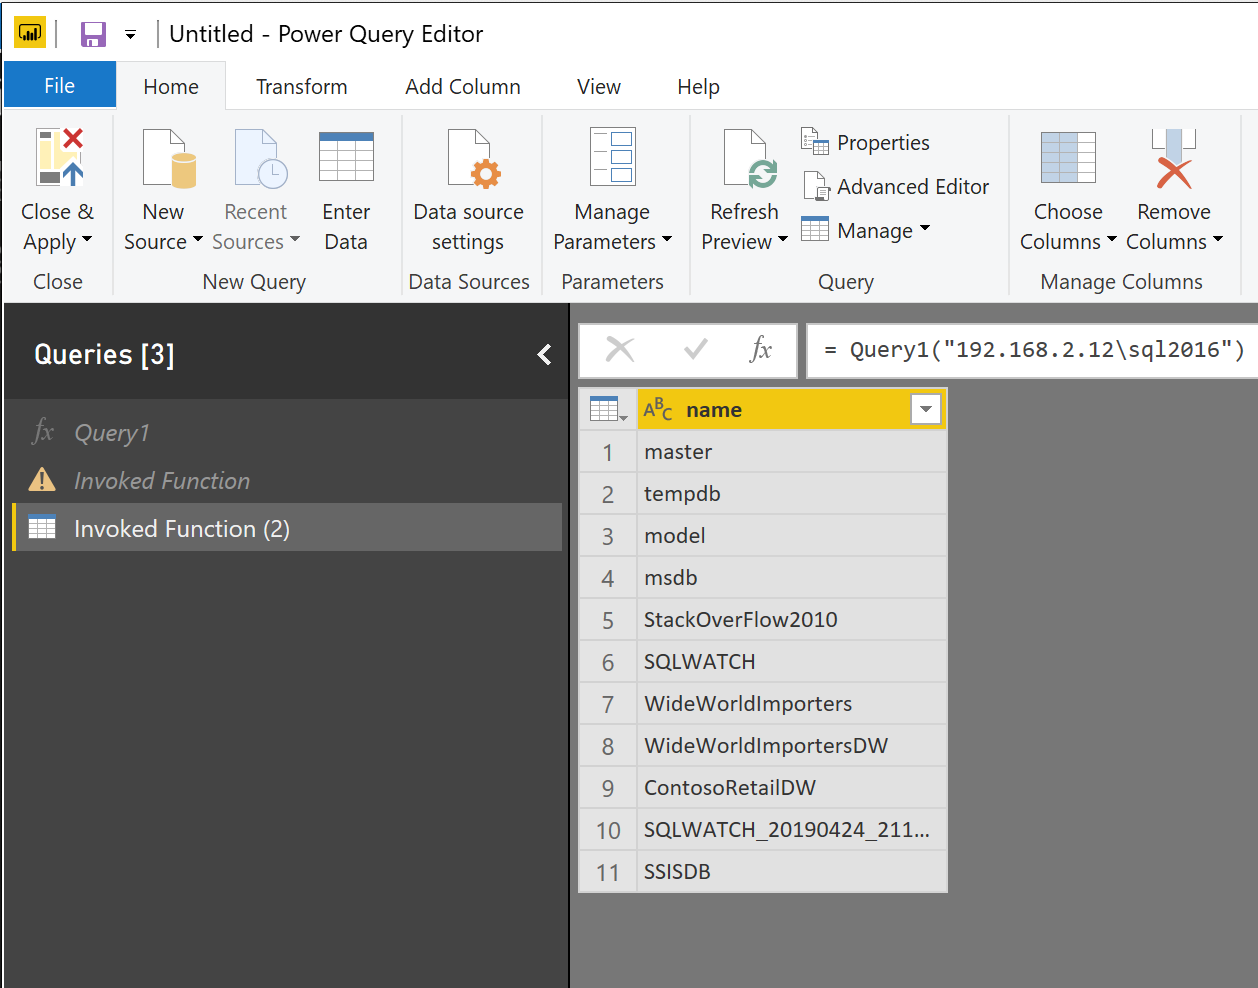
Invoking Custom Function
Now we need the ability to invoke this function against our list of servers. Firstly, we are going to need a list of servers, let’s create new data set by entering data directly:


We can now create a new data set by referencing our list of servers. Think of it as a view, when original list changes, the reference set will also change.
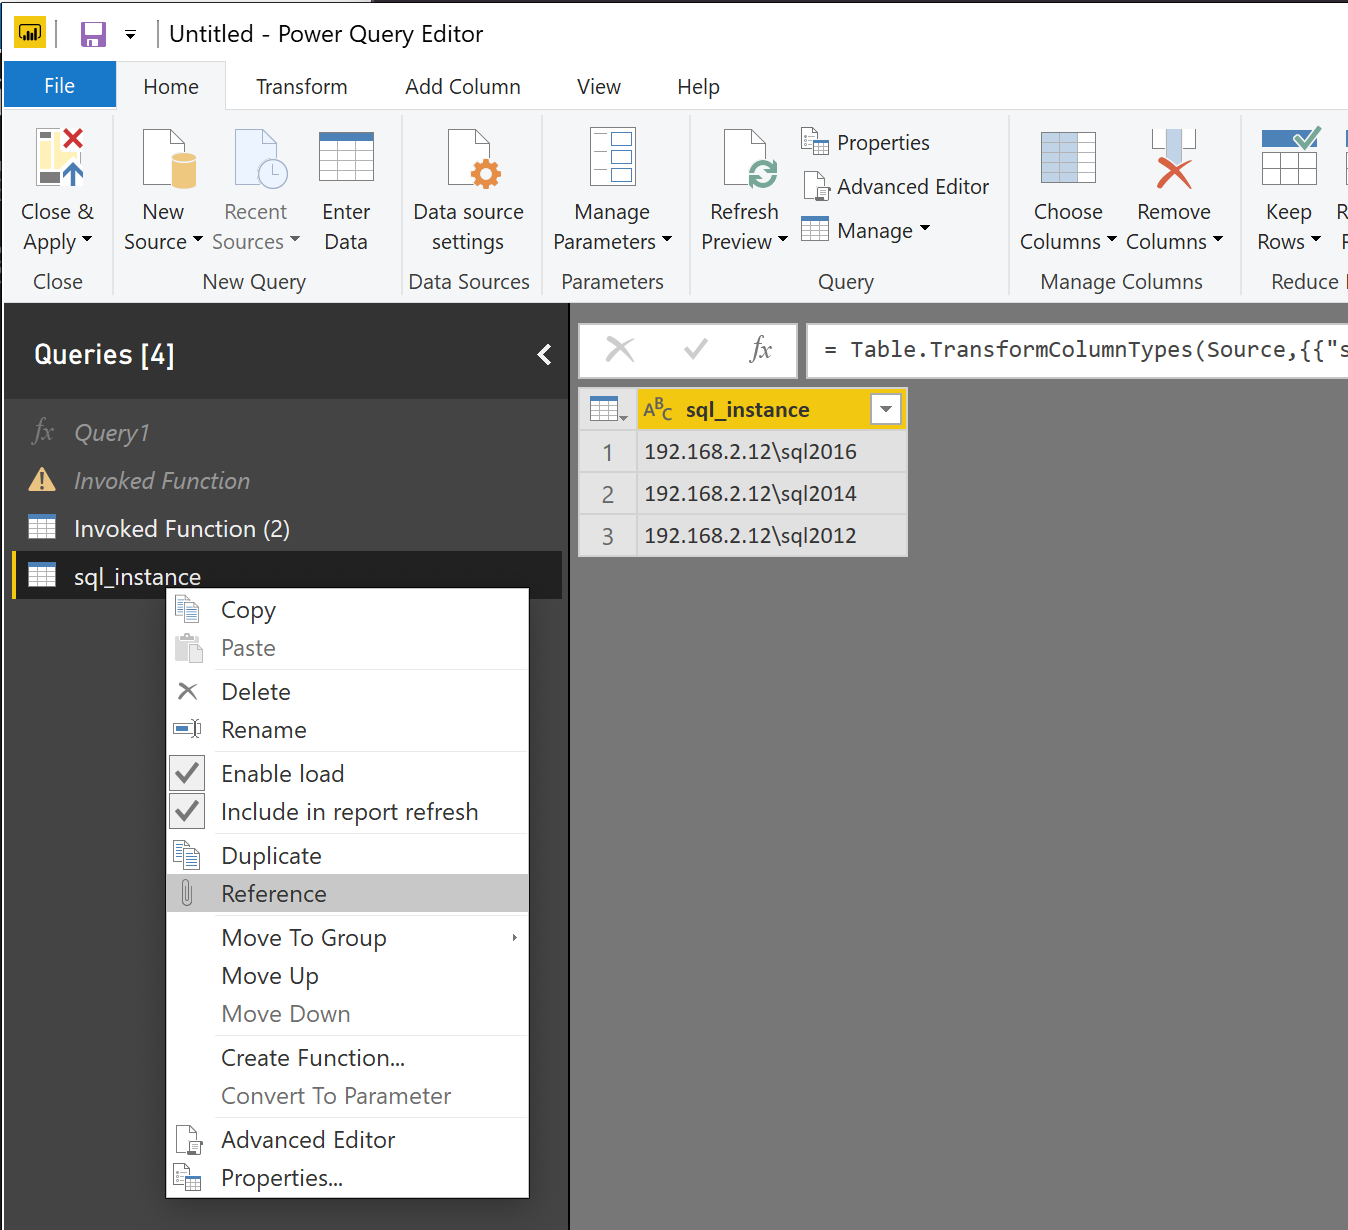
We can now invoke our data retrieval function against each row of the sql_instance table and pass the actual sql_instance as an input parameter into the function:
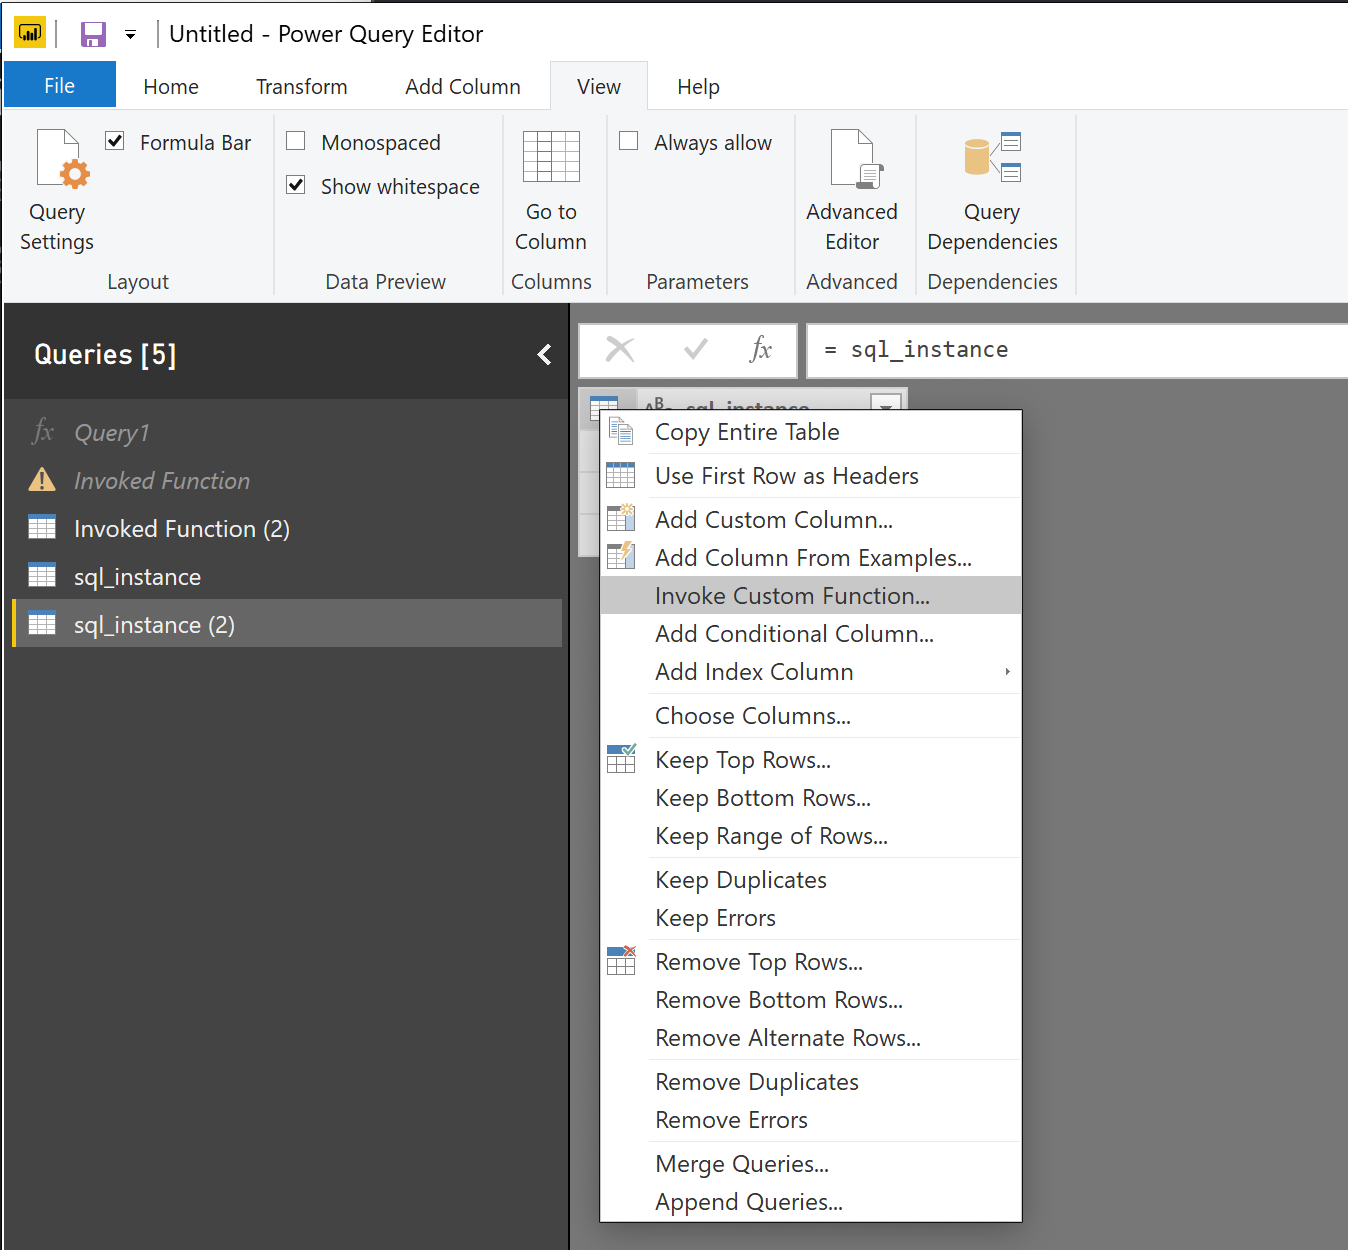
In the next dialogue box, we can tell the column name that will contain results from the function, and which column to pass into the function. In our case we only have one:
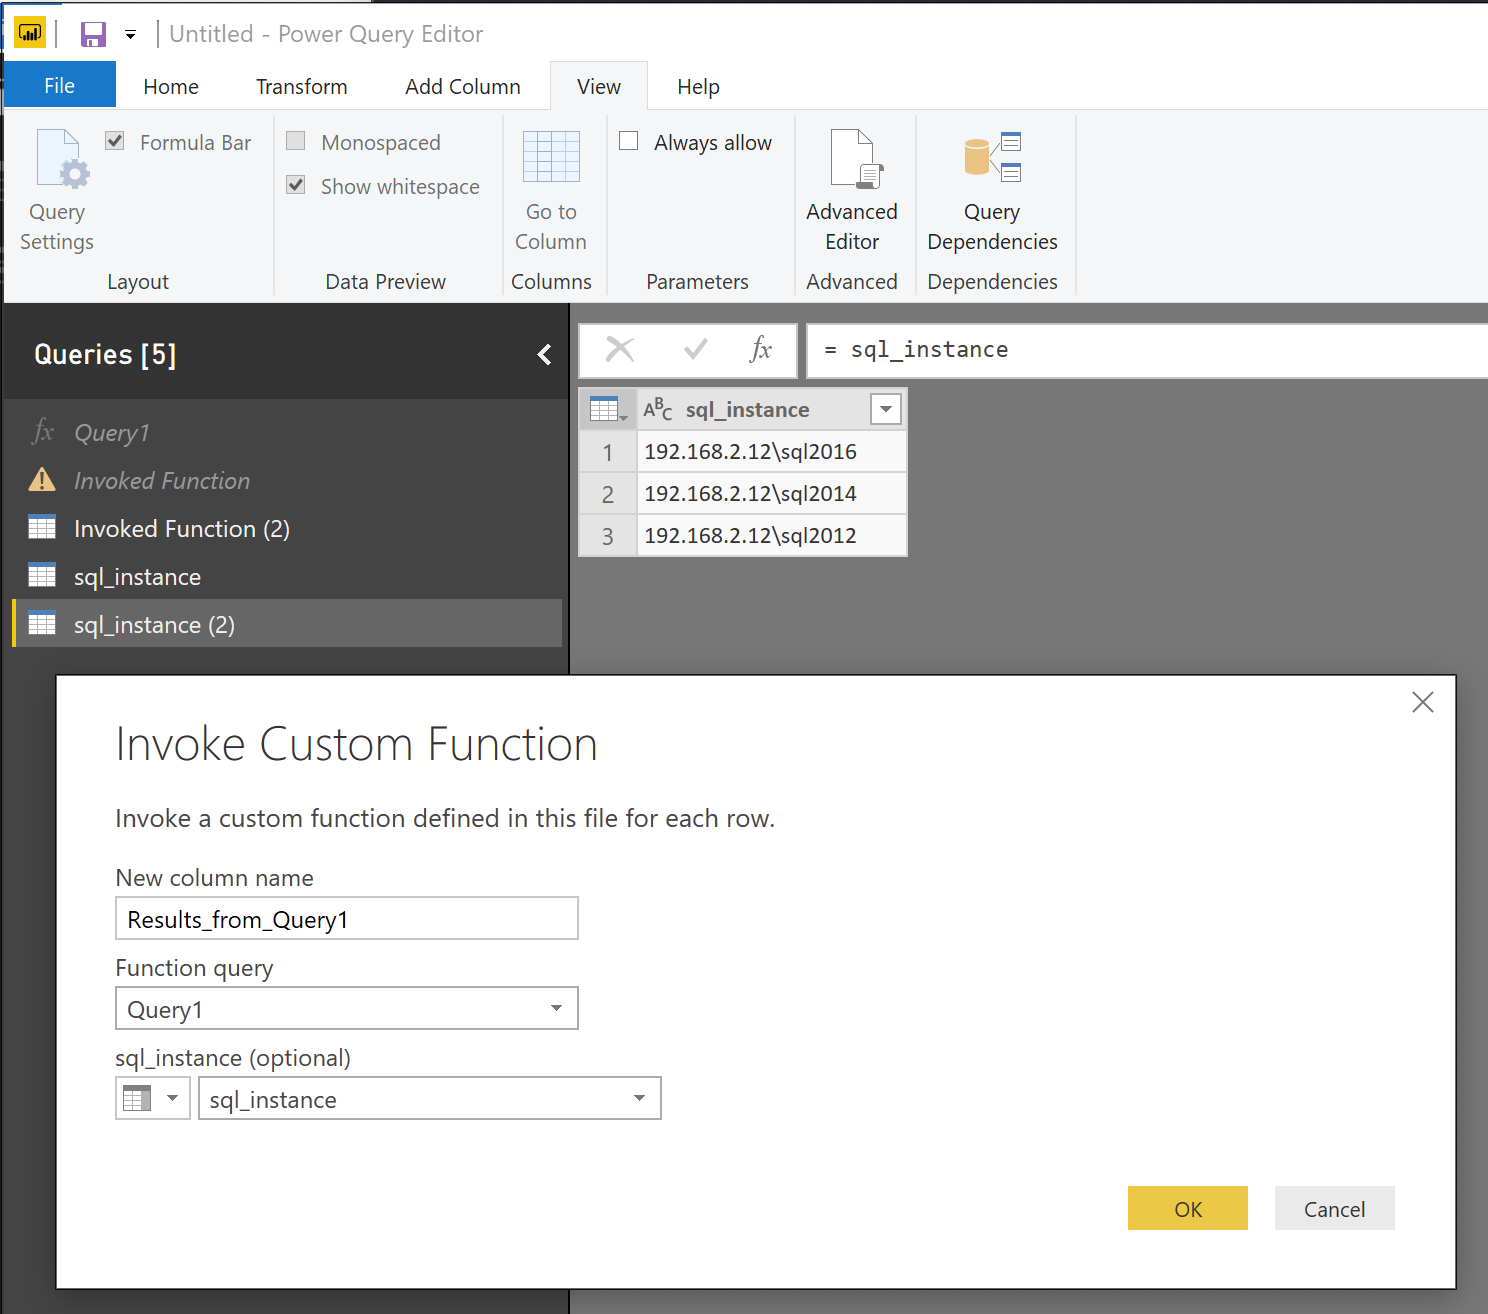
You may be asked for credentials:
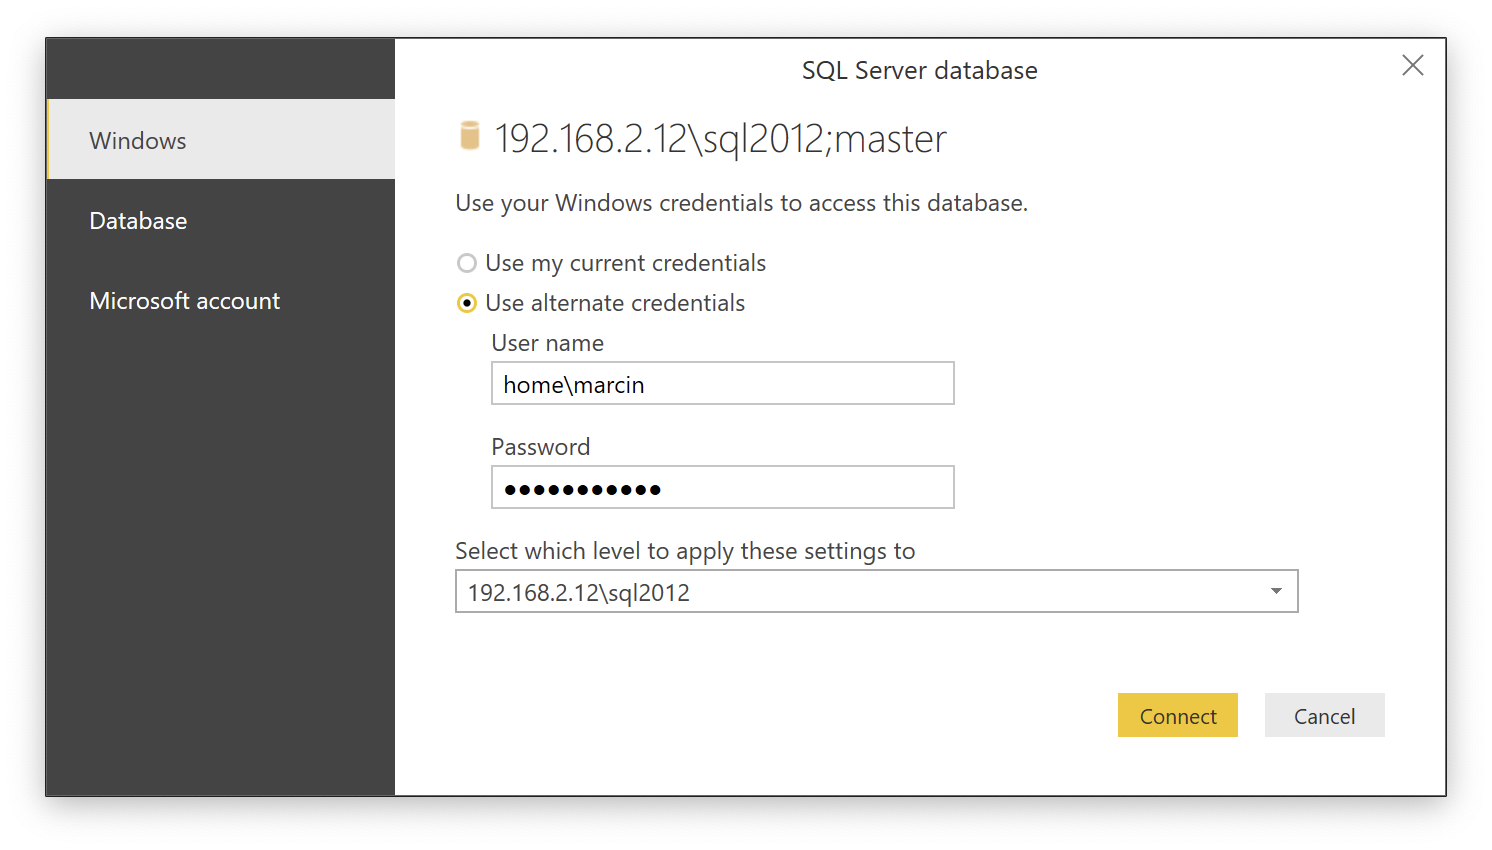
Here are the results, an original list of servers and the corresponding results from the function stored as an array:
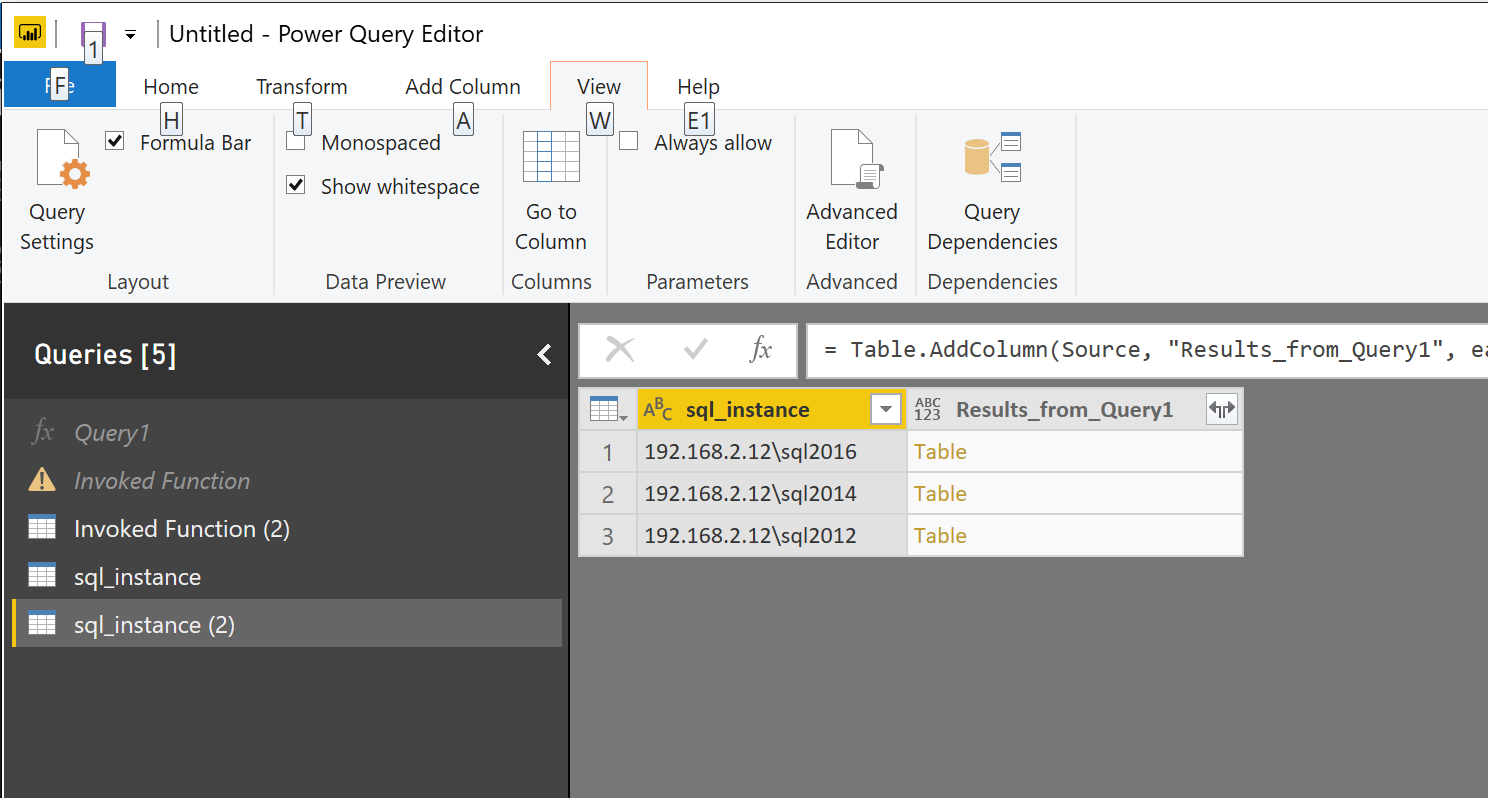
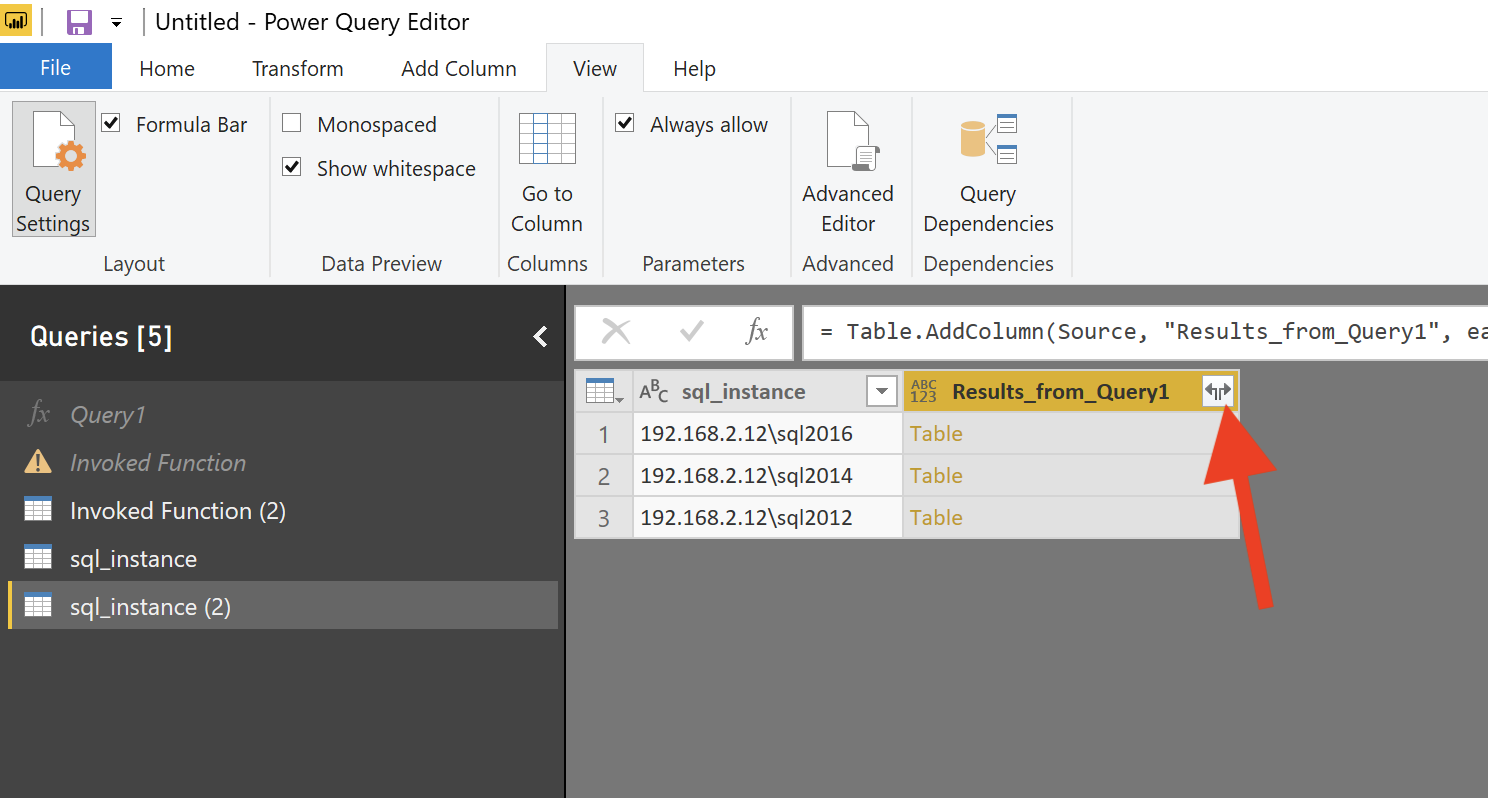
We are now going to expand the array and convert into table. Click on the expand button in the right corner:
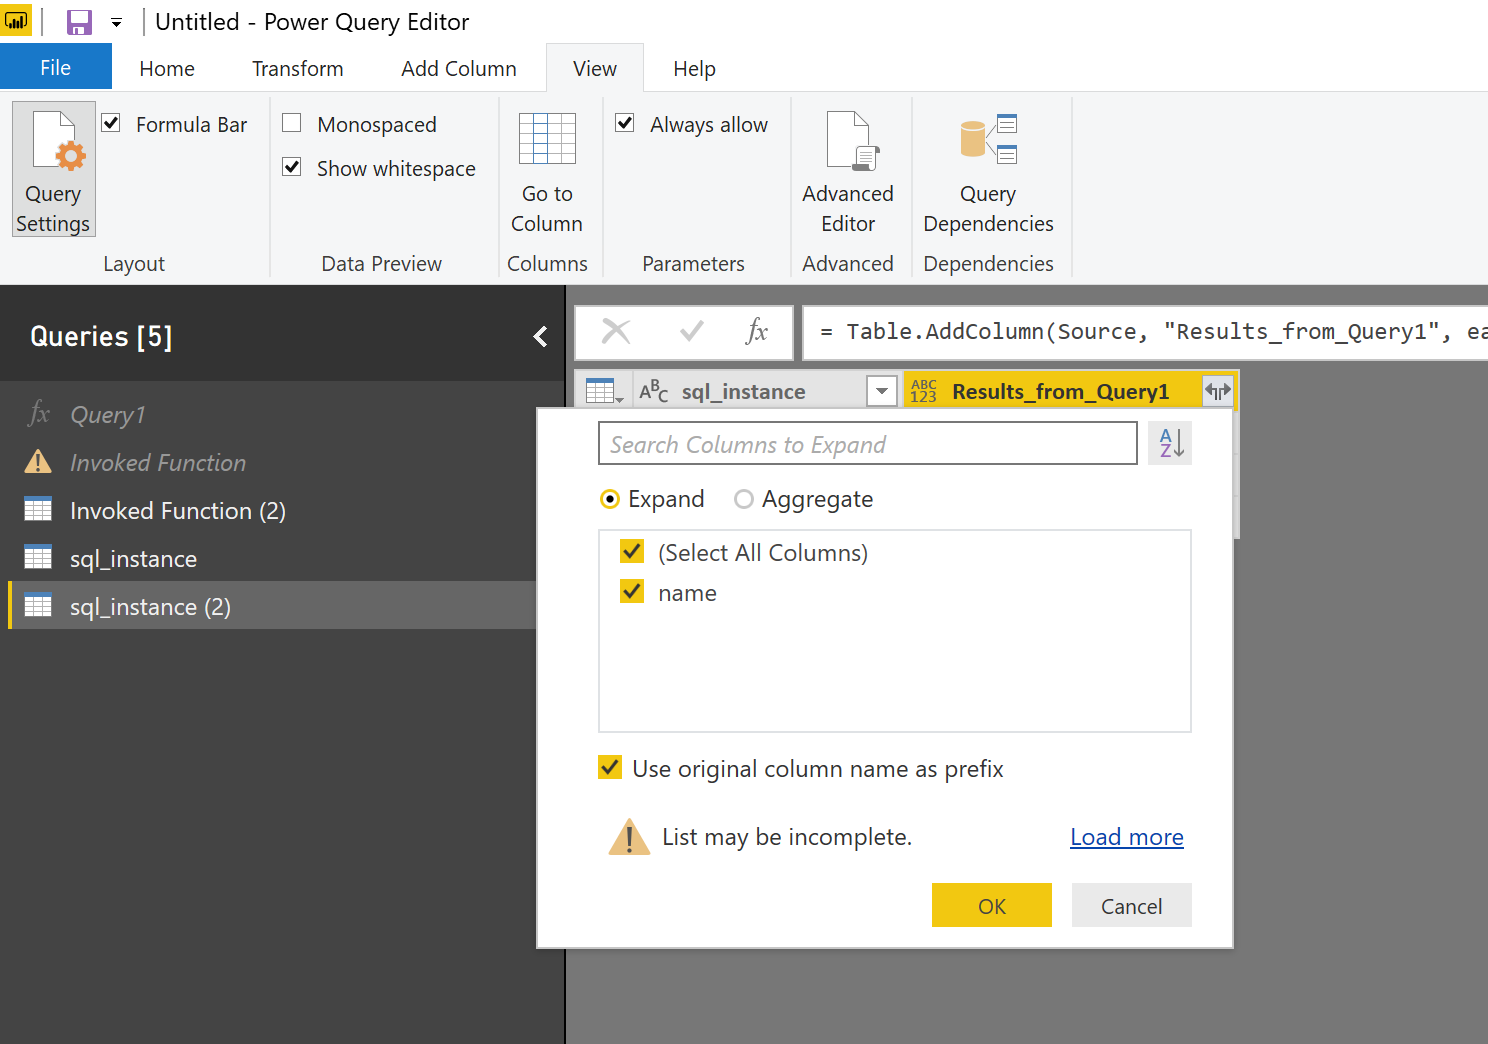
You can select which columns from show, in our case we only have one: name
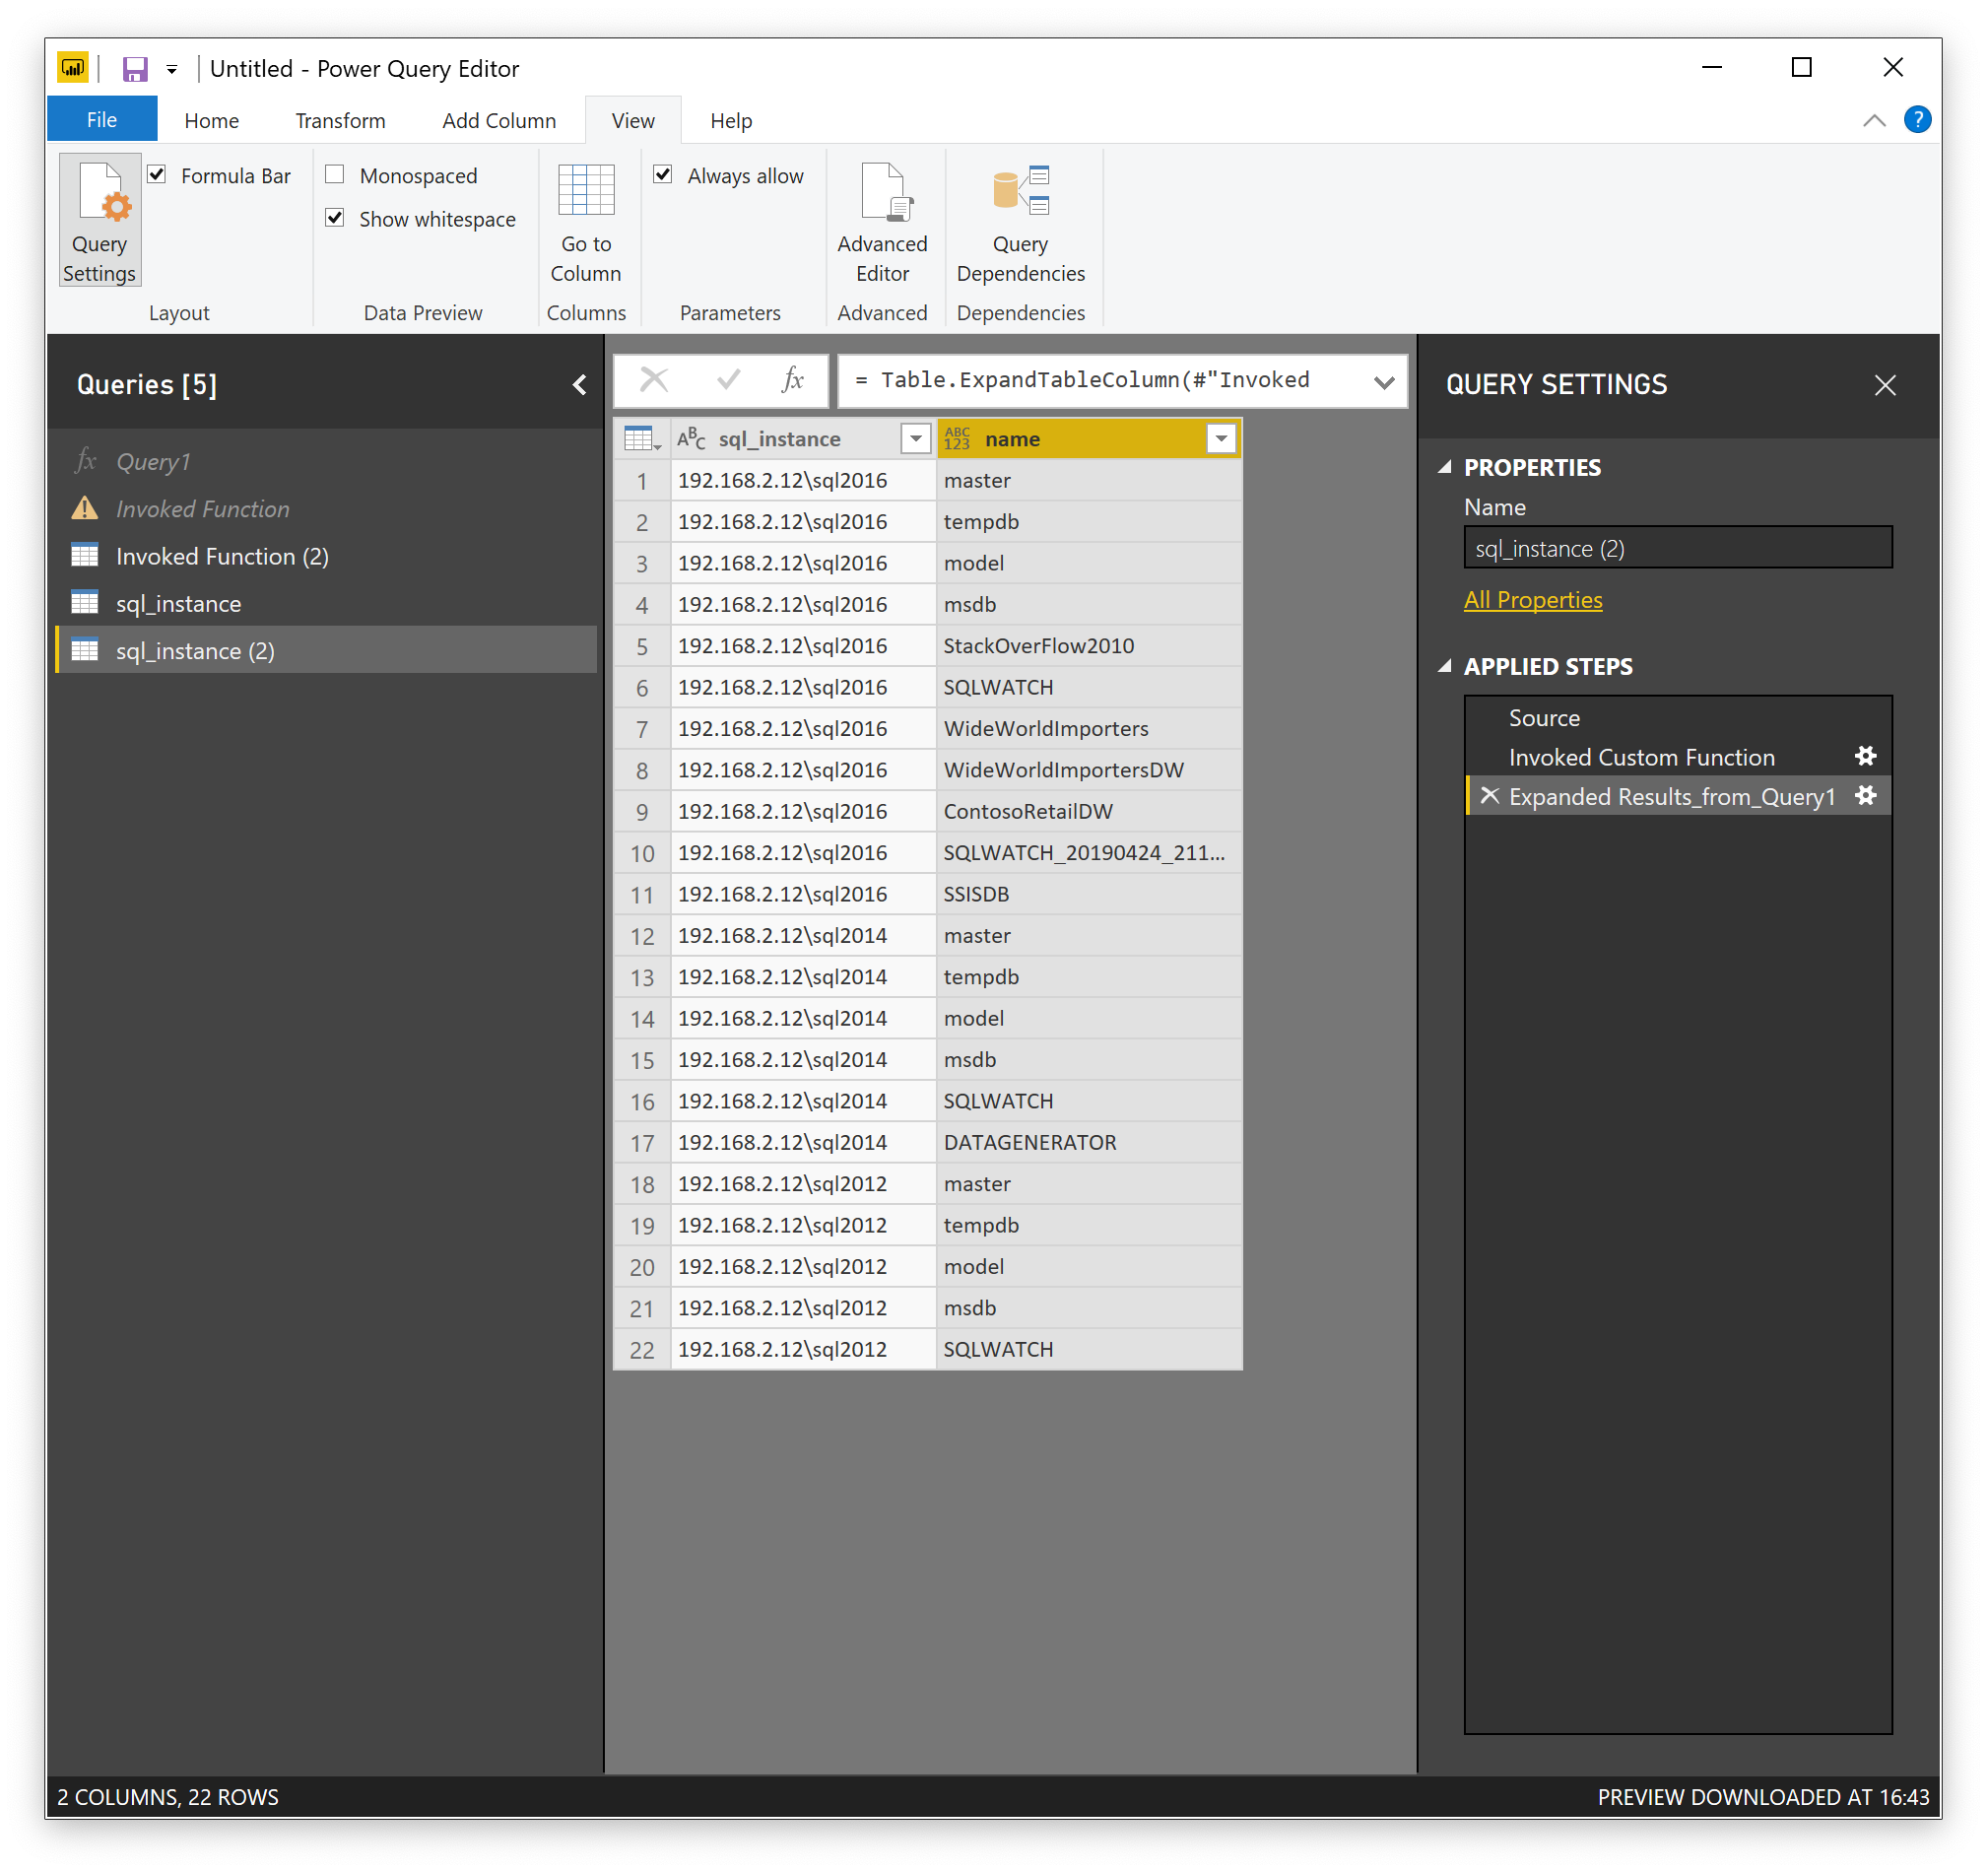
And now we have the list of all servers and the corresponding databases for each:
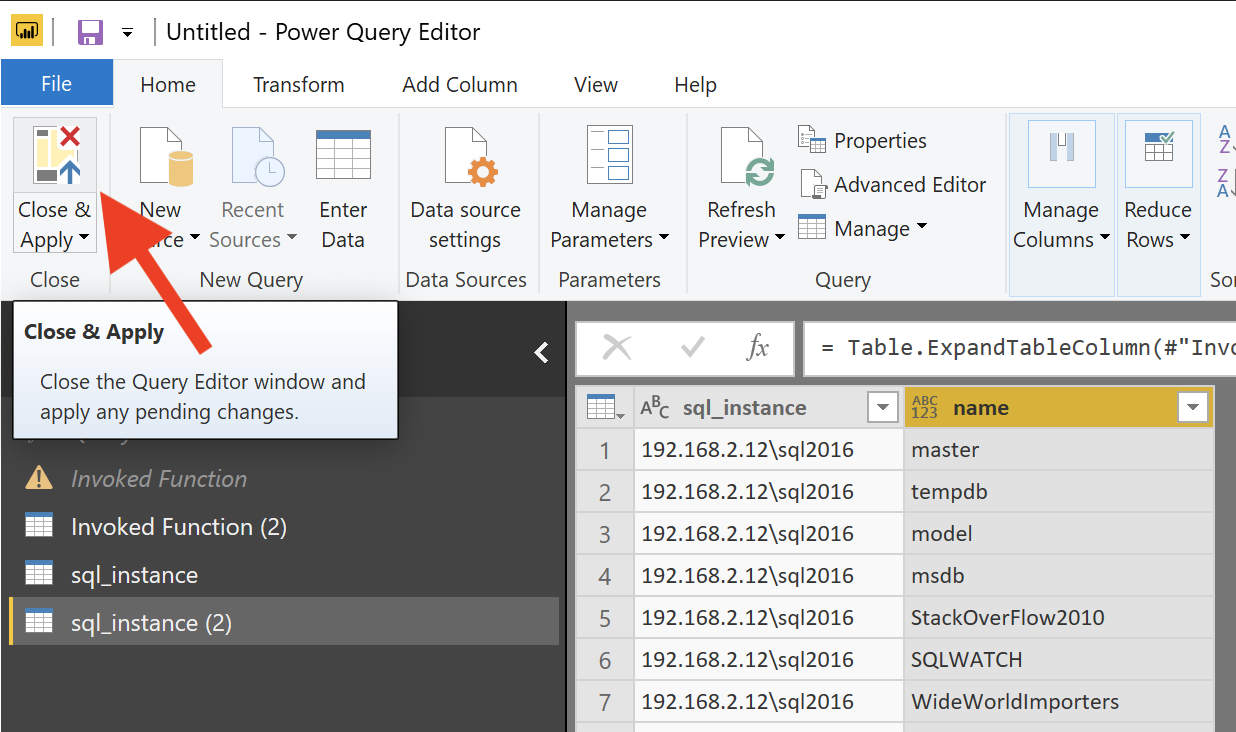
Click Close & Apply to save the query and return to the main Power BI window:
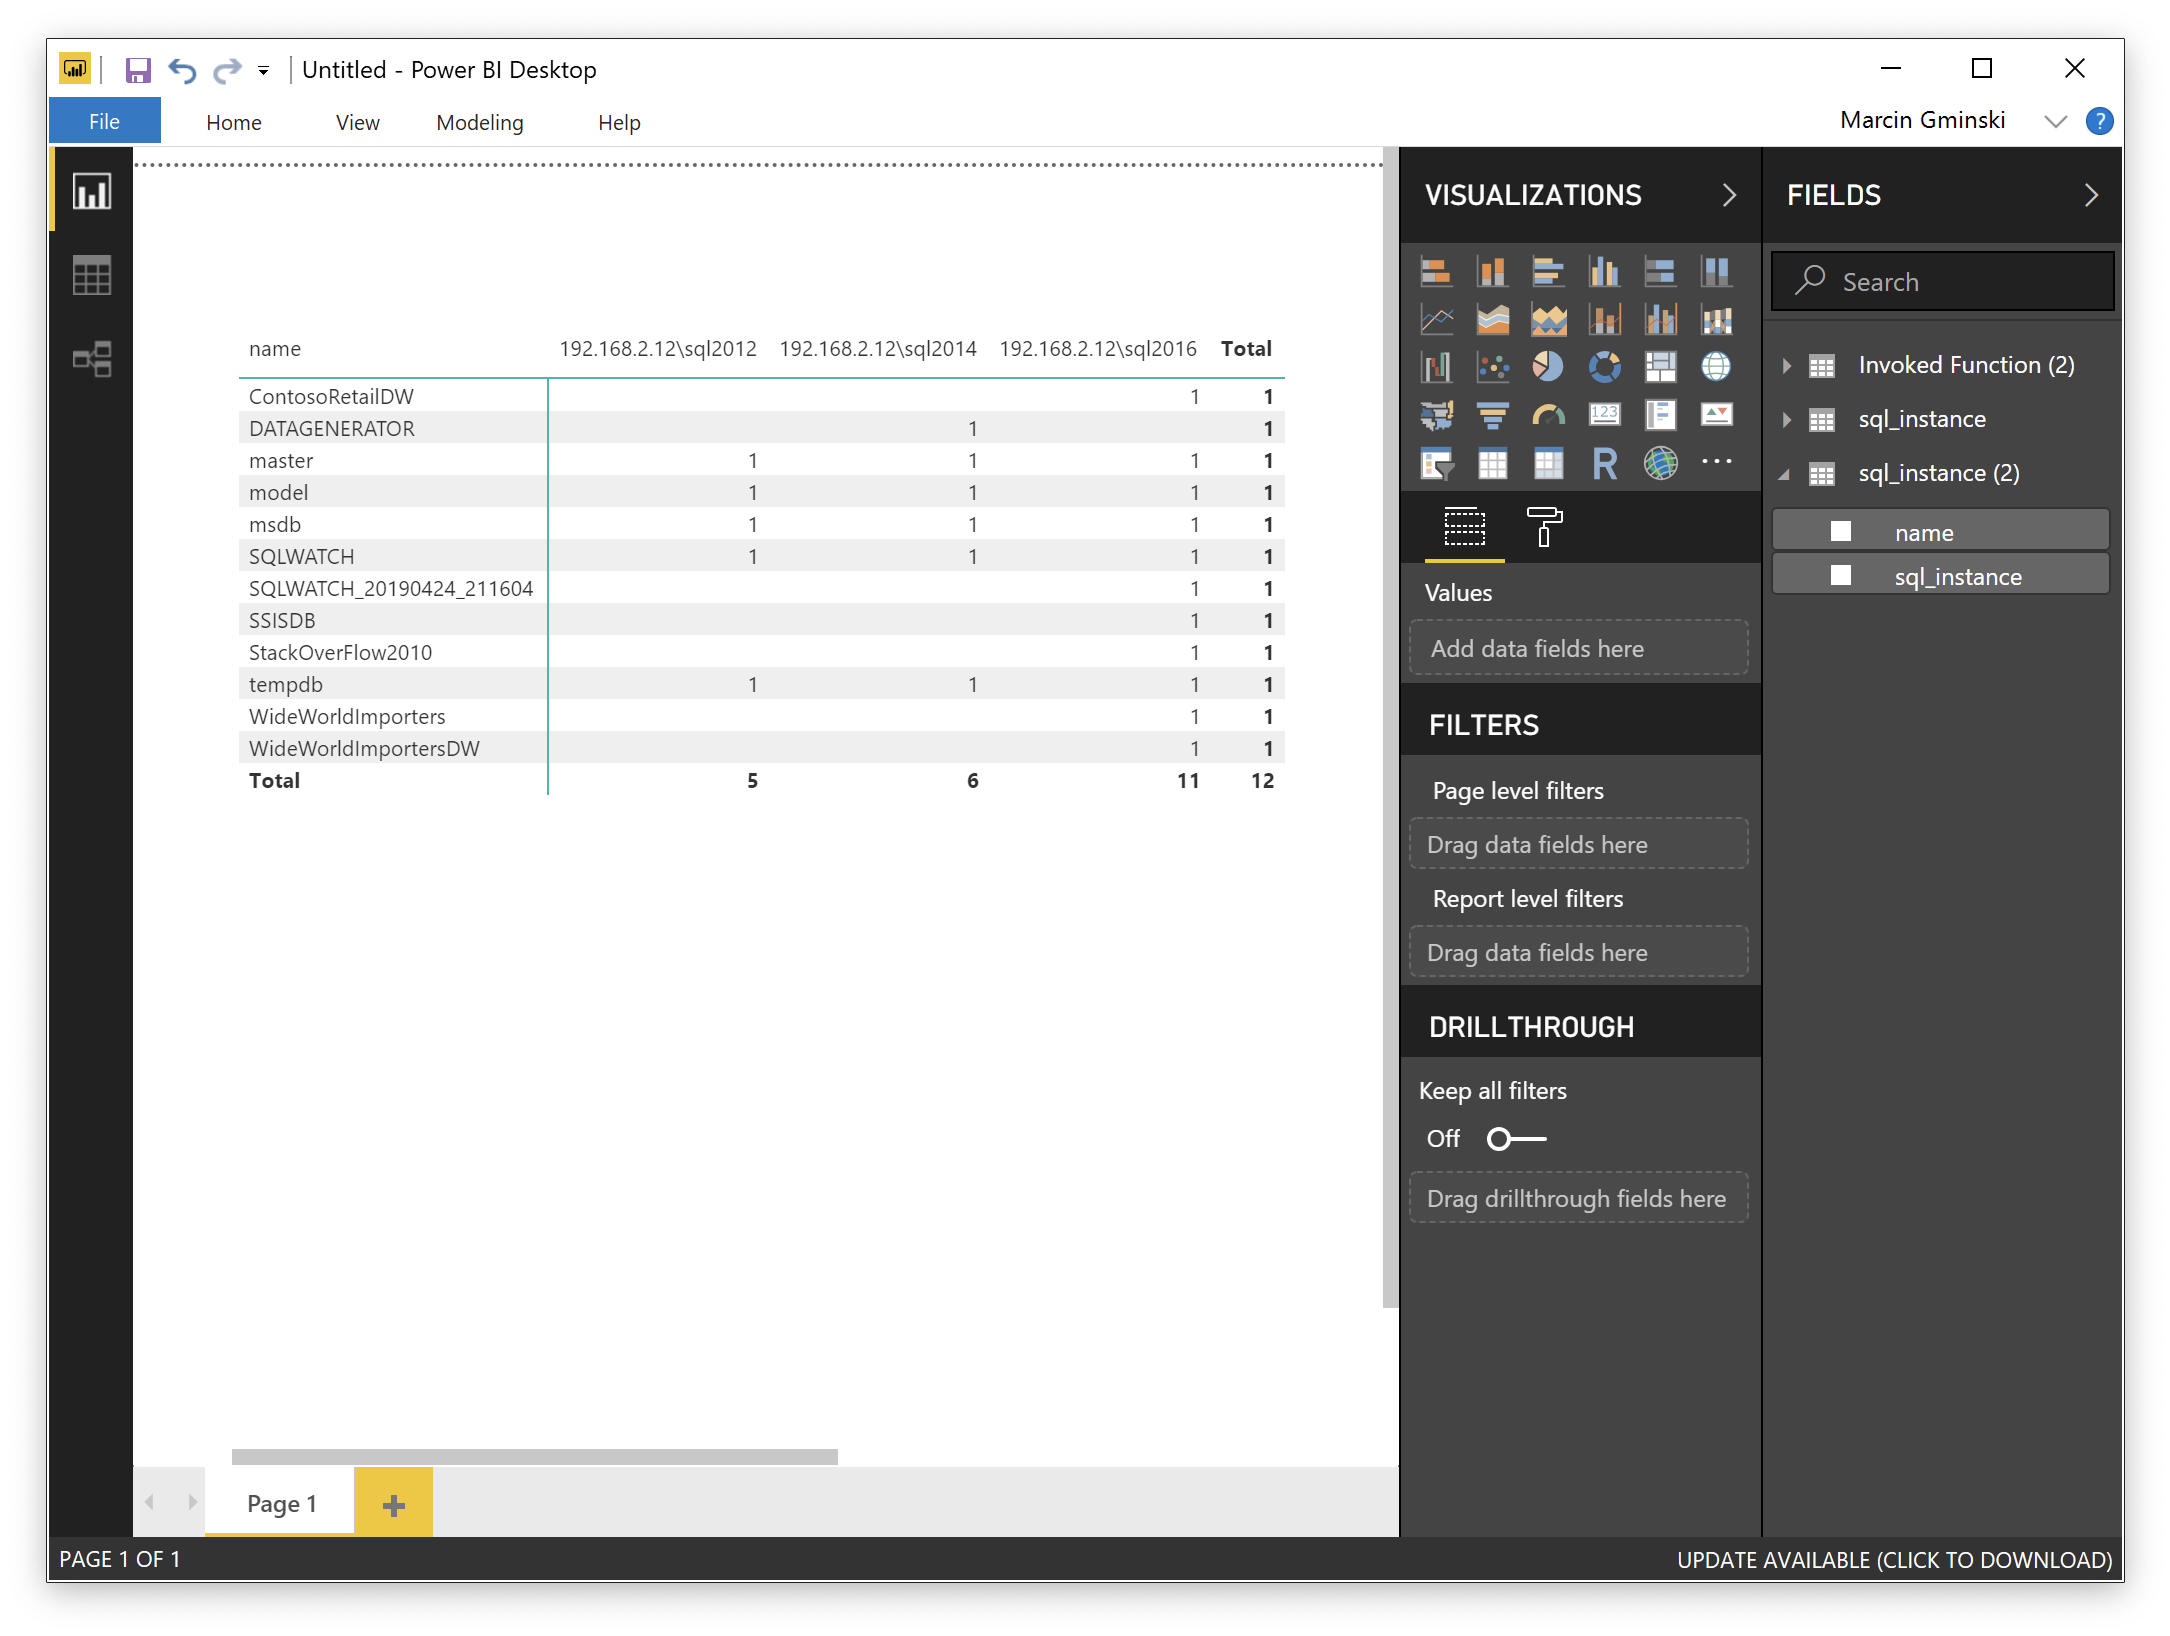
We should now have our data from all servers available in Power BI:
Summary
This is a very simple example but a fundamental design of the SQLWATCH dashboard. This approach allows for getting the same metrics data into PowerBI from multiple servers in a dynamic way. You can use it to report on SQL Agent jobs across your estate, simple performance metrics or anything you can think of. Instead of having a list of servers hardcoded in the dashboard, a better idea would be to have it linked to your Central Management Server. The same approach should also work in the PowerBI Service.
Example file
You can download the example PowerBI dashboard here: PowerBI_Dynamic_Query_Example